JCuda Debugging
Overview
This page summarizes how to debug JCuda applications and CUDA kernels in JCuda
Introduction
Debugging GPU-based applications is hard. Debugging GPU-based applications that cross the language boundaries between Java and C is even harder. The lack of integrated tool support for debugging CUDA via Java limits the possibilities to analyze in detail what is happening in an application. The (albeit few) approaches for debugging JCuda applications are shown here.
Detecting errors at API level
The simplest case is when errors can be detected at the API level. That is, when errors are not caused by bugs in CUDA kernels, but by errors in the API calls. Nearly all CUDA functions return an error code when something goes wrong. In JCuda, these errors can be detected quite easily: All libraries allow setting a flag that causes a
CudaException to be thrown
when the return value from any function indicates an error. So when there is a problem with an application, the first debugging step should be to call
JCuda.setExceptionsEnabled(true);
as the first line of the
main method. This is done
in all the samples, so that
the tedious checks of all function return values can be omitted:
If any function returns an error code, an exception will be thrown
that also contains a human-readable representation of the actual
error code.
Note: This flag has to be set for every library individually. So, for example, in order to detect API level errors in an application that uses JCublas, one additionally has to call
JCublas.setExceptionsEnabled(true).Detecting errors in kernels
Detecting errors in kernels is a bit more difficult. For native CUDA applications, there are sophisticated tools like NVIDIA Nsight for Visual Studio or NVIDIA Nsight for Eclipse. But for Java development, no such tools exist. So the only option for detecting errors in kernels is to use cuda-memcheck.
For details about how to use
cuda-memcheck, you have to refer to
the cuda-memcheck user guide.
This section will only explain the basic workflow and prerequisites for debugging a CUDA
kernel in JCuda with cuda-memcheck.The following description refers to the JCudaVectorAdd example. This is the same sample that is also used in the Tutorial, which shows in detail how to create, compile, load and execute CUDA kernels.
For illustration, the vector addition kernel that is part of this sample will be modified here to cause invalid memory accesses:
extern "C"
|
When this kernel is compiled, loaded and executed as described in the Tutorial, it will (likely) run normally, and only report that the results of the computation are wrong.
Again: Despite the invalid memory accesses, the program will not necessarily crash. There is nothing like an
ArrayIndexOutOfBoundsException in CUDA.
It may just silently compute the wrong result.
In more complex scenarios, however, the program may crash. Due to the asynchronous nature of CUDA, and due to the unpredictable consequences of overwriting arbitrary memory locations, the program may crash later, in a seemingly unrelated function - probably with reporting an unspecific error code like
CUDA_ERROR_LAUNCH_FAILED.In order to detect or rule out such errors,
cuda-memcheck may
be used. It is installed together with the CUDA toolkit,
and should be available at the command prompt after the installation.In the simplest case, it expects an executable as the only command line parameter. So it is possible to execute a JCuda program in
cuda-memcheck with the following command line: cuda-memcheck java -cp .;jcuda.jar JCudaVectorAddIf the
classpath of the application is larger, or additional
parameters should be passed to the application or to cuda-memcheck,
then it is convenient to summarize the start of the JCuda application in
a small shell script or batch file. For example, creating a file like
JCudaVectorAddStart.bat that only contains the line java -cp .;jcuda.jar JCudaVectorAddallows running the JCuda program in
cuda-memcheck by just calling cuda-memcheck JCudaVectorAddStart.batThe output of
cuda-memcheck may look as follows: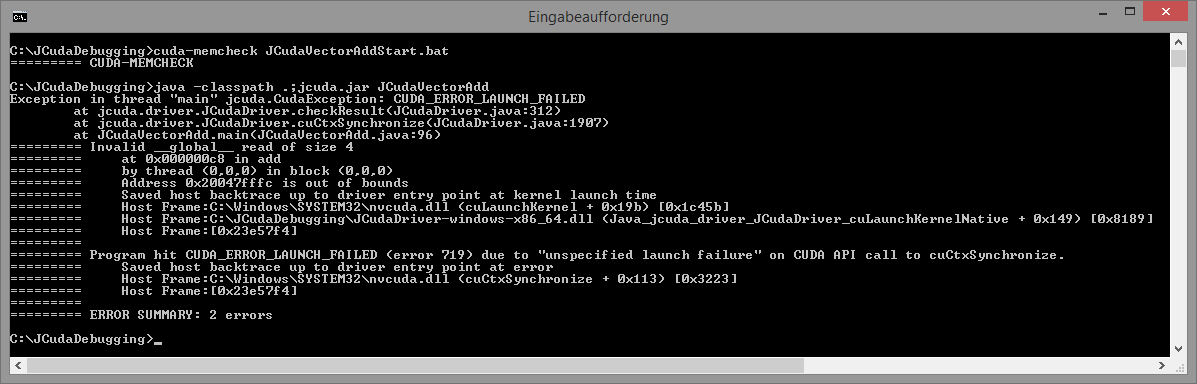 |
Note: If
cuda-memcheck prints an error message like Internal Memcheck Error: Memcheck failed initialization as some other tools is currently attached. Please make sure that nvprof and Nsight Visual Studio Edition are not being run simultaneouslythen refer to the Troubleshooting section below!
As shown in the screenshot above,
cuda-memcheck will report that there is an error: Invalid __global__ read of size 4This corresponds to the first erroneous line in the kernel, where the input is read from an invalid memory location. It will also say which thread caused this invalid access, and in which block this thread was located. After this line has been fixed, re-compiling and running the program will report another error:
Invalid __global__ write of size 4This corresponds to the line where the result should be written to an invalid memory location. Fixing this as well will cause
cuda-memcheck to
report ERROR SUMMARY: 0 errorsin the next call.
Preserving line numbers
Guessing the line that corresponds to an invalid read/write operation is only possible for trivial kernels. It is possible to preserve line number information in PTX- and CUBIN files, which can later be reported by
cuda-memcheck. Therefore, the -lineinfo
parameter has to be passed to the NVCC when the PTX- or CUBIN file is
compiled: nvcc -lineinfo -ptx JCudaVectorAddKernel.cuAfter compiling the erroneous kernel with the
-lineinfo
flag and starting the program in cuda-memcheck, the output
may look as follows: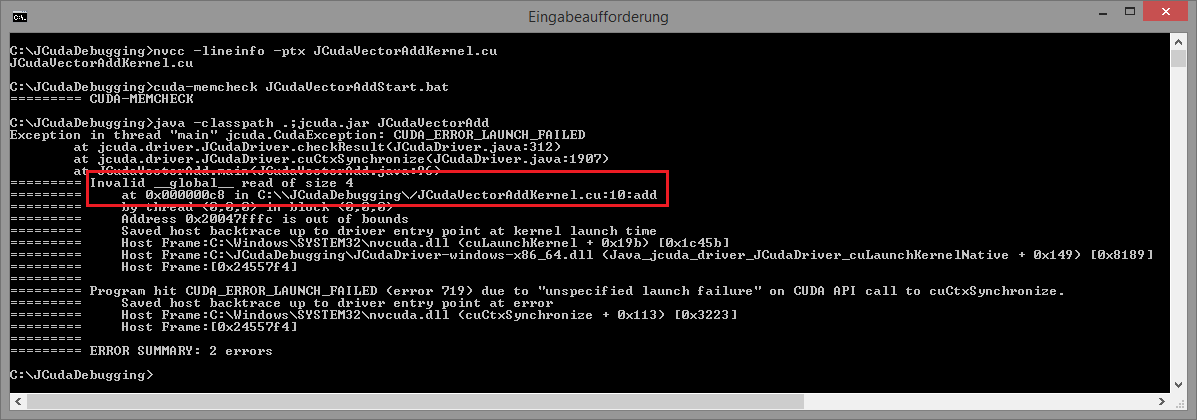 |
Now,
cuda-memcheck will say that the error was in the
JCudaVectorAddKernel.cu file, at line 10,
in the add kernel.Troubleshooting
If
cuda-memcheck prints an error message like Internal Memcheck Error: Memcheck failed initialization as some other tools is currently attached. Please make sure that nvprof and Nsight Visual Studio Edition are not being run simultaneouslythen you have probably installed some of the NVIDIA Nsight profiling tools. These will set environment variables
CUDA_INJECTION32_PATH and CUDA_INJECTION64_PATHpointing to some files in the NVIDIA directories. In order to use
cuda-memcheck,
you may have to reset these variables. This can simply be done in the console where
you want to execute cuda-memcheck, by setting them to be empty. For Windows:
set CUDA_INJECTION32_PATH=
and
set CUDA_INJECTION64_PATH=
For Linux:
unset CUDA_INJECTION32_PATH
and
unset CUDA_INJECTION64_PATH